Demographics of South East Queensland
Understanding the Workforce Demographics of South East Queensland
This report will be based on current demographics of South East Queensland (SEQ), using the most available census data. Using this data, a better understanding of the future workforce can be understood. The report will also outline future trends based on data forecasted by Government and other accredited institutions. In this report the following Local Government Areas (LGA) will be mentioned as they represent the populous who are most likely work within the Brisbane region. These areas include Moreton bay, Ipswich, Logan, Redlands and for the purpose of this report, will also include Darling Downs. The report will first provide an understanding of the demographics in the LGA’s mentioned, with a specific focus on age, family/marital status, current workforce, and income. These factors historically provide a firm understanding of what regions may have issues with either future workforce and availability of employment.
Demographics - South East Queensland
South-East Queensland represents the most populated area in Queensland, and as of 2024 saw a total population of almost 4,000,000 people; this was a growth of almost 100,000 people from the previous year. Those employed in SEQ represented 1,700,000 people - an increase of 250,000 people from the previous census. Diving deeper into this, the census noted there were more females residing in SEQ (51%), with Men representing 49% of the population. The median age of those within SEQ provided by the 2021 census data was 38, and at the time of the census, had just over 2,200,000 eligible voters.
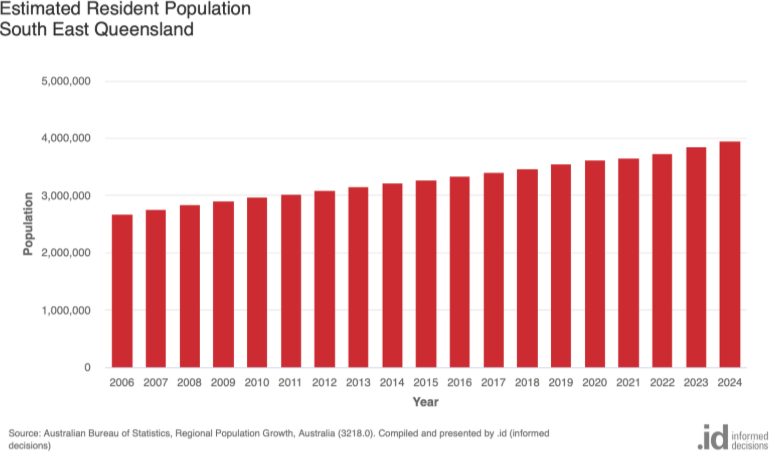
Resident Population of SEQ
South East Queenslands age structure in 2021 showed that there was a higher proportion of those between the age of 35-49. and was higher than the National average, as well as those between 18-24. It was also noted that SEQ had a lower percentage of those within pre-retirement and retirement age. The groups with the most noticeable shift in population changes were 70-84 (+85,000), 35-49 (+75,000) and 25-34 (+48.227)
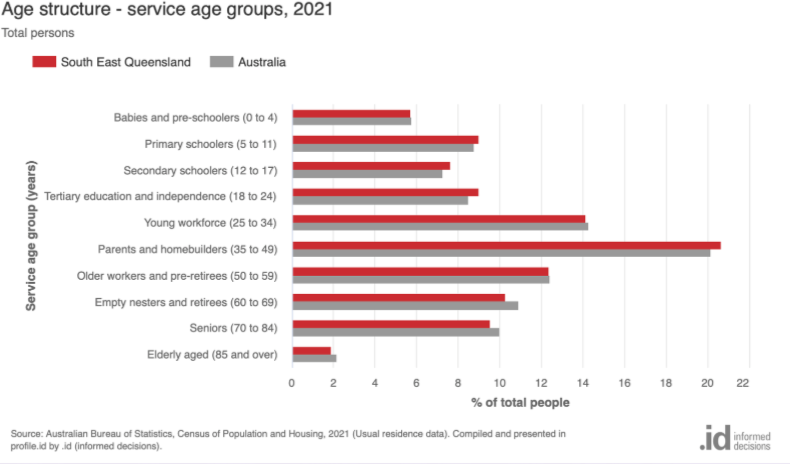
Age Structure - Service Age groups, 2021
South East Queensland had a slightly lower percentage of persons born overseas with just under 1,000,000 representing this group, with 68.5% of people in the region being Australian born. There was an increase of 136,000 people and 281,000 respectively, when compared to the previous census data. Those whom were not born in Australia are mainly from the following regions the United Kingdom (180,000 people, +11,000 increase), New Zealand (174,000 people, +7,000 increase) and India (61,000 people, +20,000 increase).
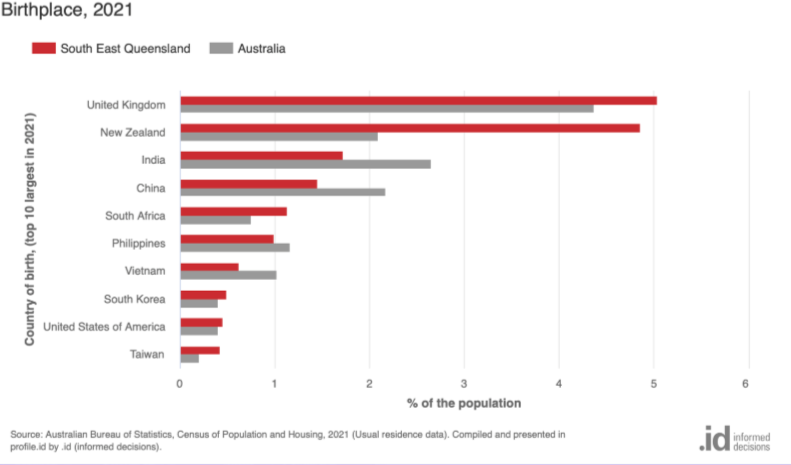
Birthplace, 2021
The current work force in SEQ (this includes people over the age of 15) is just over 1,800,000 and represents 63% of the population. Those employed mainly undertook full-time employment (55%) with part-time employment represented 30% of the work force. From data provided from the 2021 and 2016 census, it was noted that there was an increase of more then 150,000 people participating in the work force. The top industries that those in SEQ work within based on the 2021 census data are Health Care and Social Assistance (270,000 people, +73,000 increase), Construction (165,000 people, +23,000 increase) and Retail Trade (162,000 people, +13,000 increase). The lowest participation rates included Mining (19,000 people, +2000 increase), Electricity, Gas, Water and Waste Services (18,000 people, +4000 increase) and Agriculture, Forestry and Fishing (16,000 people, +1,000 increase).
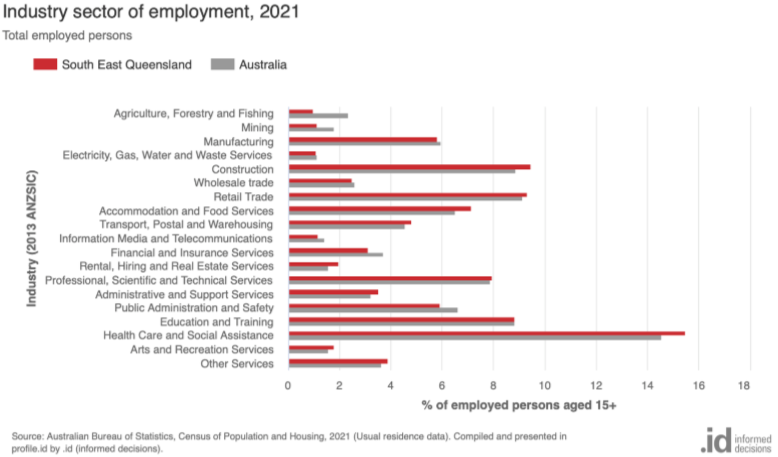
Industry Sector of Employment, 2021
Household types in SEQ are not too far different from the National data provided, and similar trends can be noted. The top 3 groups are on par with that data, and include Couple with Children (400,000 or 29.8% of households), Couples without Children (357,000 or 26.2% of the households) and Lone Persons (307,000 people or 22.5% of households). These groups also represented the biggest change from previous data with Lone Persons having the largest change with a +55,000 increase from the 2016 census.
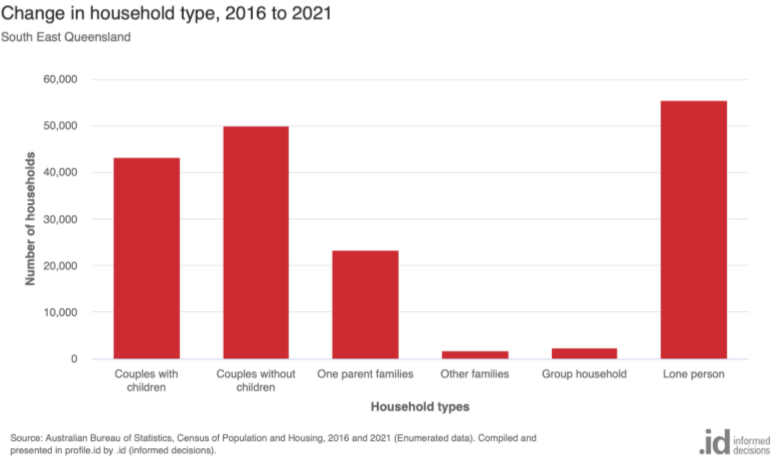
Change in Household Type, 2016 to 2021
Weekly gross income for those who live within SEQ was generally between $300-$2000 per week, with the top gross incomes being represented as $1000-1249 (9.4% of people), $800-999 (8.7% of people) and Negative/Nil income (8.2% of people; it should be noted that those in the latter group primarily had a financial loss due to business or investment. The first two groups were higher than the national average, but the difference is not enough to be noted, with those earning over $2000 per week representing 12% of SEQ, which was on par with the National census data.
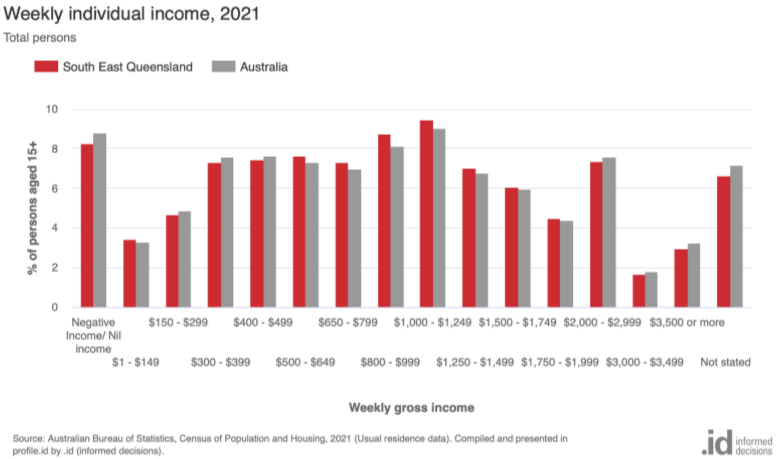
Weekly Individual Income, 2021
.idcommunity (2021) Demographic Resources: About the profile areas. Available at: https://profile.id.com.au/comseq/about?WebID=100 (Accessed: 7 January 2026)